This is a technical post exploring how to use Variational Auto-Encoders for computer-assisted creativity in generating novel skincare formulations.
What is Variational Auto-Encoders
Just a short introduction to bring everyone up to speed:
A Variational Auto-Encoder (VAE) is like a two-way translator that learns to convert complex data into a compact set of numbers and back again. It consists of an encoder that compresses the input data, a middle layer called the “latent space,” and a decoder that reconstructs the data from this compressed form.
What makes VAEs special is that their latent space is organized in a way that similar inputs end up close to each other. This means we can not only reconstruct our original inputs, but also explore the space between them to create new examples that blend features from different inputs. While these reconstructions and blends aren’t always perfect, they often capture meaningful patterns from the training data.
This ability to explore the latent space is what drives AI-assisted music generation, molecular design, image creation, and many other fields. By exploring the latent space we have a unique potential a systematic computer-assisted creativity.
Needless to say, there is already a lot of research on how to best traverse / explore this latent space. Just go on Google scholar and type in something like: “latent space traversal”. There are numerous techniques and entire new neural networks trained to navigate the latent space.
A few key points stands out from this research:
- A common exploration technique is to pick several points in the latent space and gradually move between them, creating smooth transitions between different examples.
- The most important variations in the data often align with the principal directions of the latent space — for instance, one direction might control brightness in images, while another affects shape.
- The sparsest areas of the latent space typically correspond to unusual or unique examples in the training data, making these regions less reliable for generation.
- Each latent space is shaped by its training data — a space trained on faces will organize differently than one trained on molecules, each with its own characteristic patterns and behaviors.
Now let us get concrete, and figure out what that all means.
VAE for skincare products
In building a VAE for skincare ingredient lists there are a few things we need to keep in mind:
- Each ingredient can only appear once, and should be in concentration order.
- Different ingredients can have very similar effects in terms of skincare benefits and this needs to be accounted for.
We deal with (1) in the decoding phase, by calculating the most likely sequence of ingredients given that each can only appear once. For (2) we have another model that predicts the overall skincare benefit of the product, and we input this to the VAE as well, to form a latent space that is a joint distribution between ingredient list structure and skincare benefits of said ingredient lists.
This means our latent space is a numerical representation of all known skincare products and how they affect skin. Hence the whitespace — areas between known products — represents potential novel combinations that could fill unmet skincare needs.
Finding the whitespace
As mentioned above the whitespace, or space between known examples, in the latent space represents potential novel skincare formulations. But just how do we find meaningful whitespace?
Finding meaningful whitespace in a high-dimensional latent space is challenging because the concept of “gaps” or “empty regions” becomes increasingly complex as dimensions increase. In 2D or 3D, we can visually spot empty areas, but in N-dimensional space, points that appear close in one projection might be far apart when considering all dimensions.
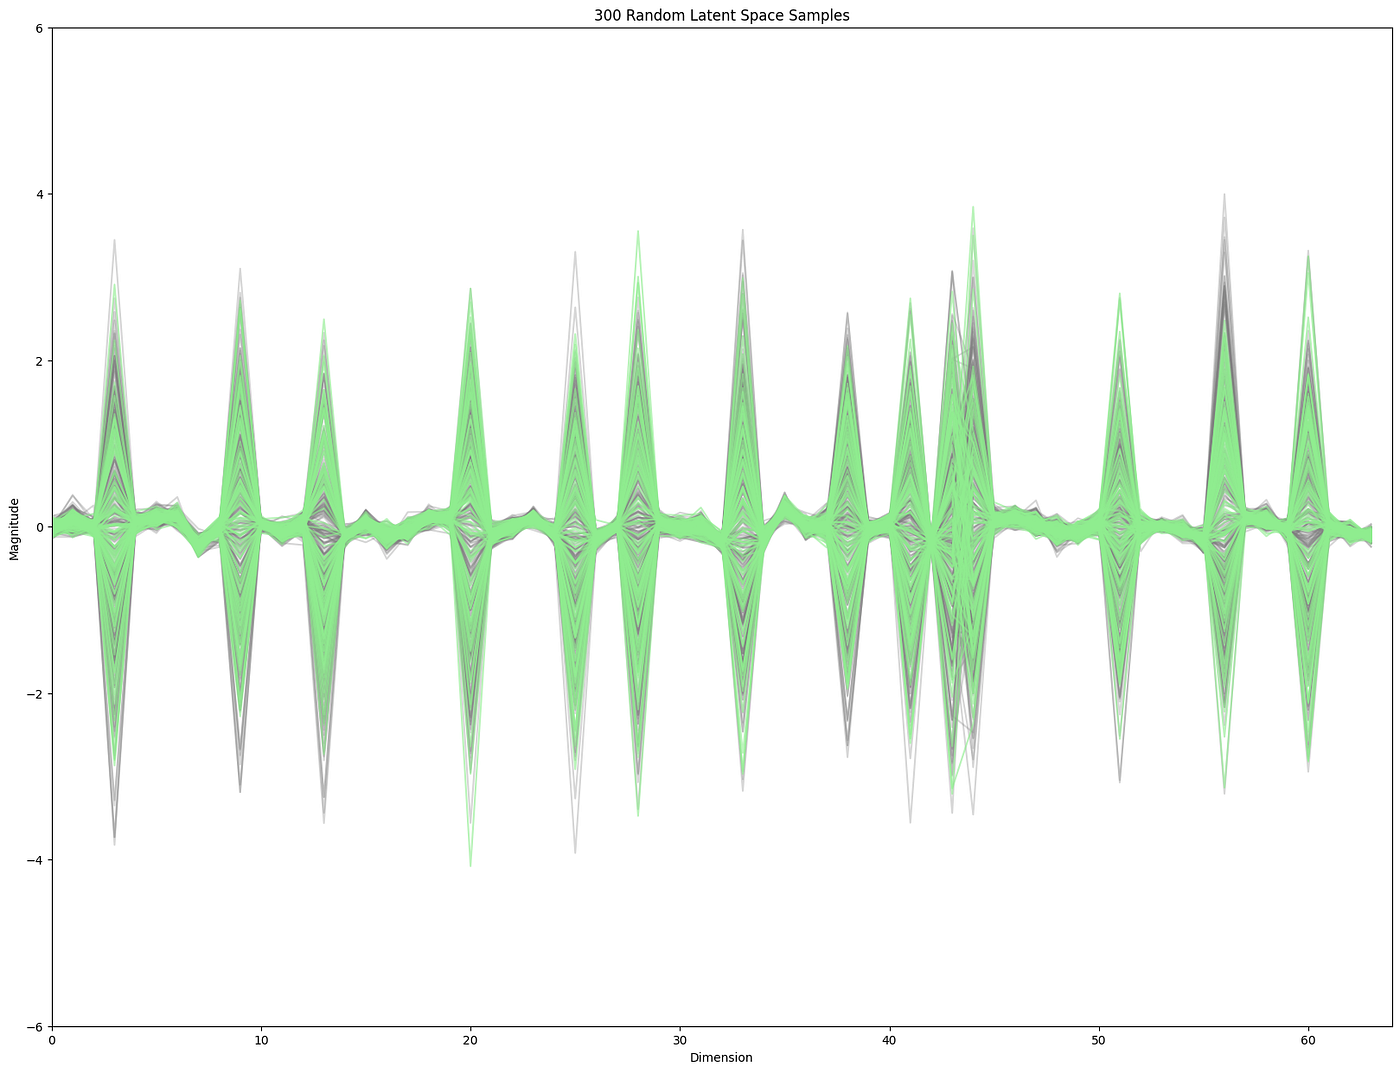
Leaning into the key takeaways from above let us start by looking at the principal directions on the data. These will be some mixture of the dimensions with the most variance.
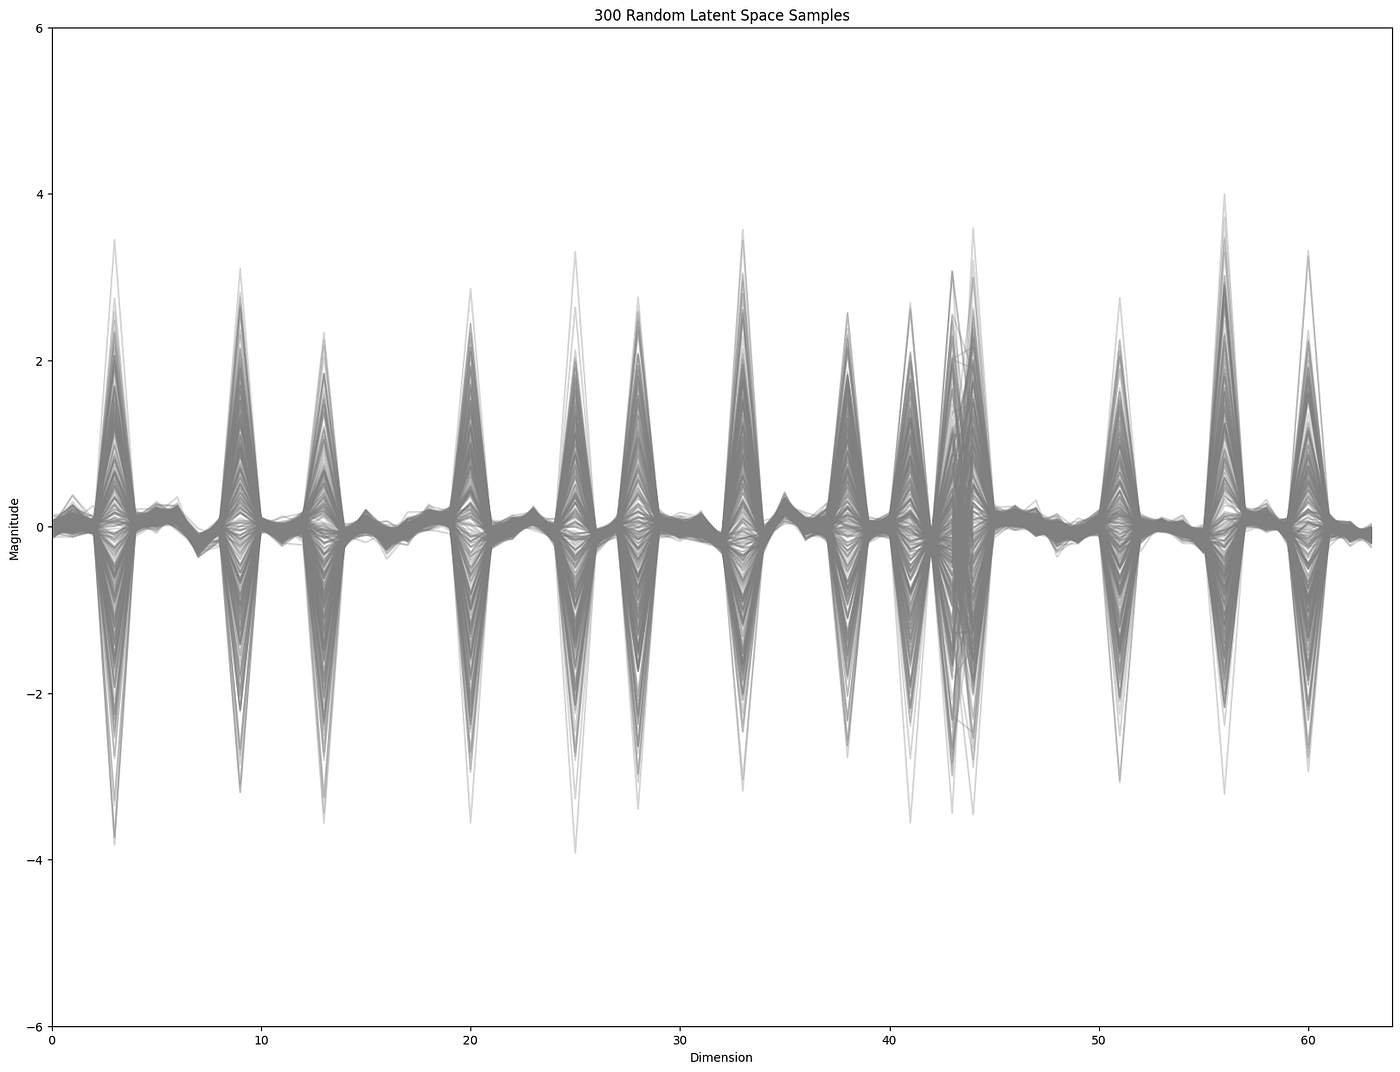
This clearly shows that some dimensions have a lot more variance than others. So standard ways of finding “sparse” regions would likely favor finding samples with some of the extreme “peaky” distributions. And this is indeed the case if we do something like a kernel density estimation of sparse samples.
from sklearn.neighbors import KernelDensity
import numpy as np

def find_sparse_regions(z_values, n_lowest=10):
    # Fit KDE
    kde = KernelDensity(bandwidth=1.0).fit(z_values)

    # Get density scores for all points
    density_scores = kde.score_samples(z_values)

    # Find points with lowest density
    sparse_indices = np.argsort(density_scores)[:n_lowest]
    return sparse_indices, density_scores
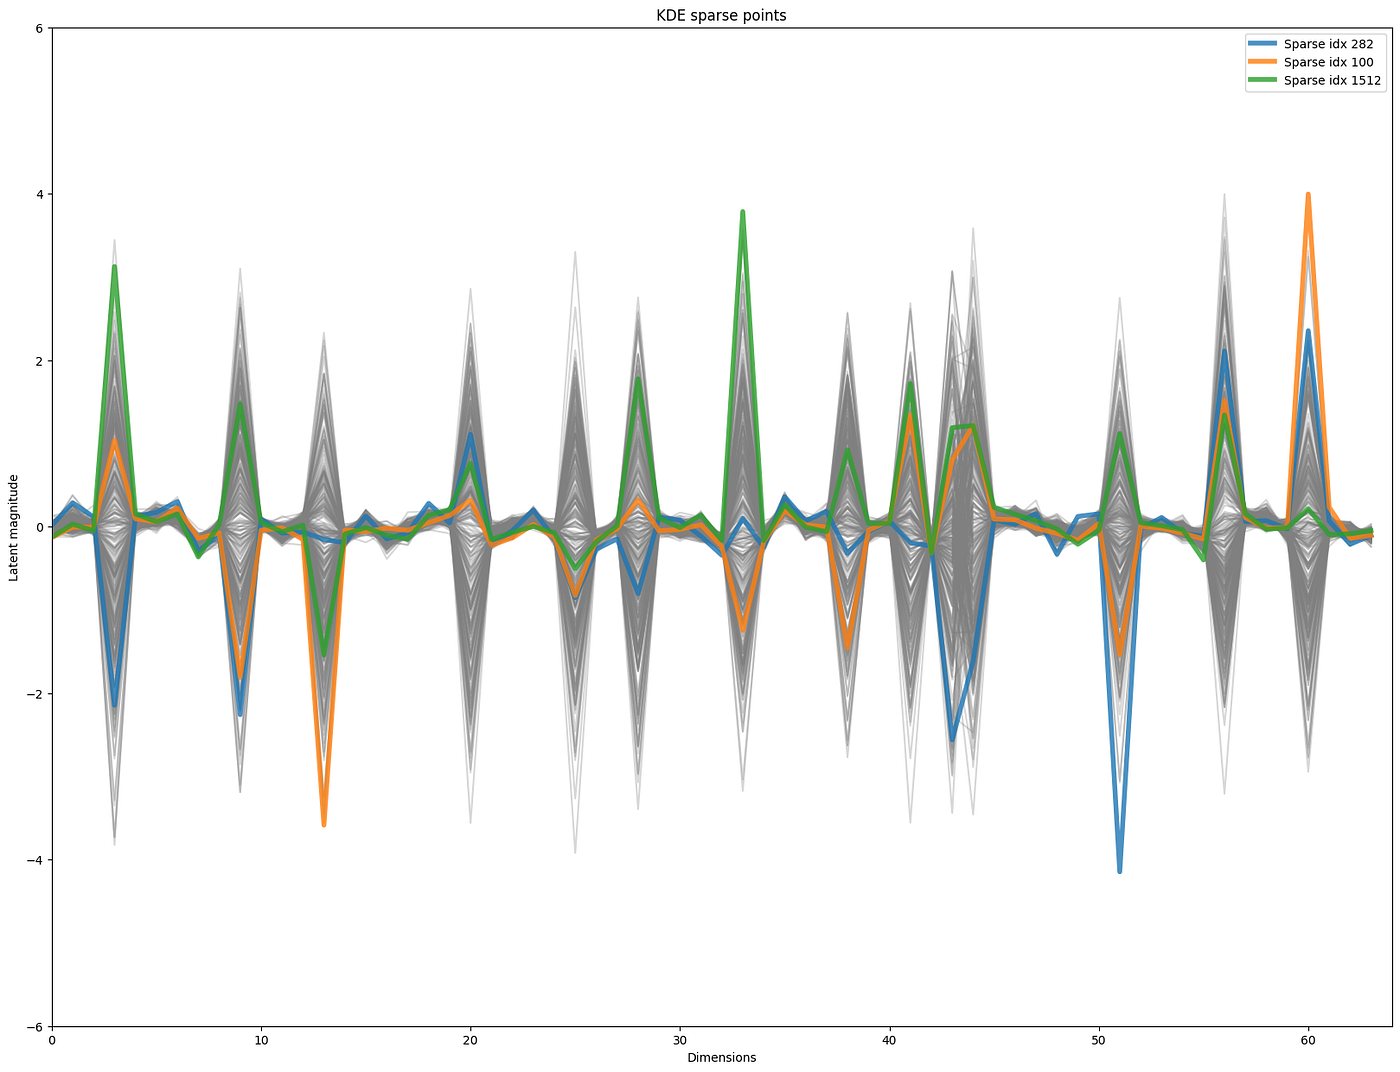
A key takeaway was that these samples could be problematic for generation of novel examples as they represent areas where the latent space is less well defined, or that they maybe outliers of the training data. So let us look further into these 3 examples which are:
Ceretin Serum from PÜR, containing a lot of silicones, Prevage Anti-Aging Eye Serum from Elizabeth Arden, also with a fair use of silicones and crosspolymers, and Oil and Pore Control Mattifier SPF 45 from Murad, which turns out to occur twice in the training data — once with a wrongly annotated ingredient list and this is the one turning up here as an outlier.
So it is fair to say that these products are not the most representative serums or moisturizers in terms of their formulation structure, and would likely not represent good starting points for meaningful novel skincare formulations.
Positional sensitivity and correlation structure
It is not (at least to me) intuitive if the positions in the latent space with high variance, are also the positions where perturbations will affect the reconstruction the most? To investigate that we can do random perturbations in a position-wise manner and compare to the original reconstructions, counting the number of differences. These perturbations can either be sampled from a N(0,1) distribution, or from a random draw of the position dependent distribution. If the high variance positions are more sensitive we should see more reconstruction deviations when perturbing these areas, which is indeed the case.
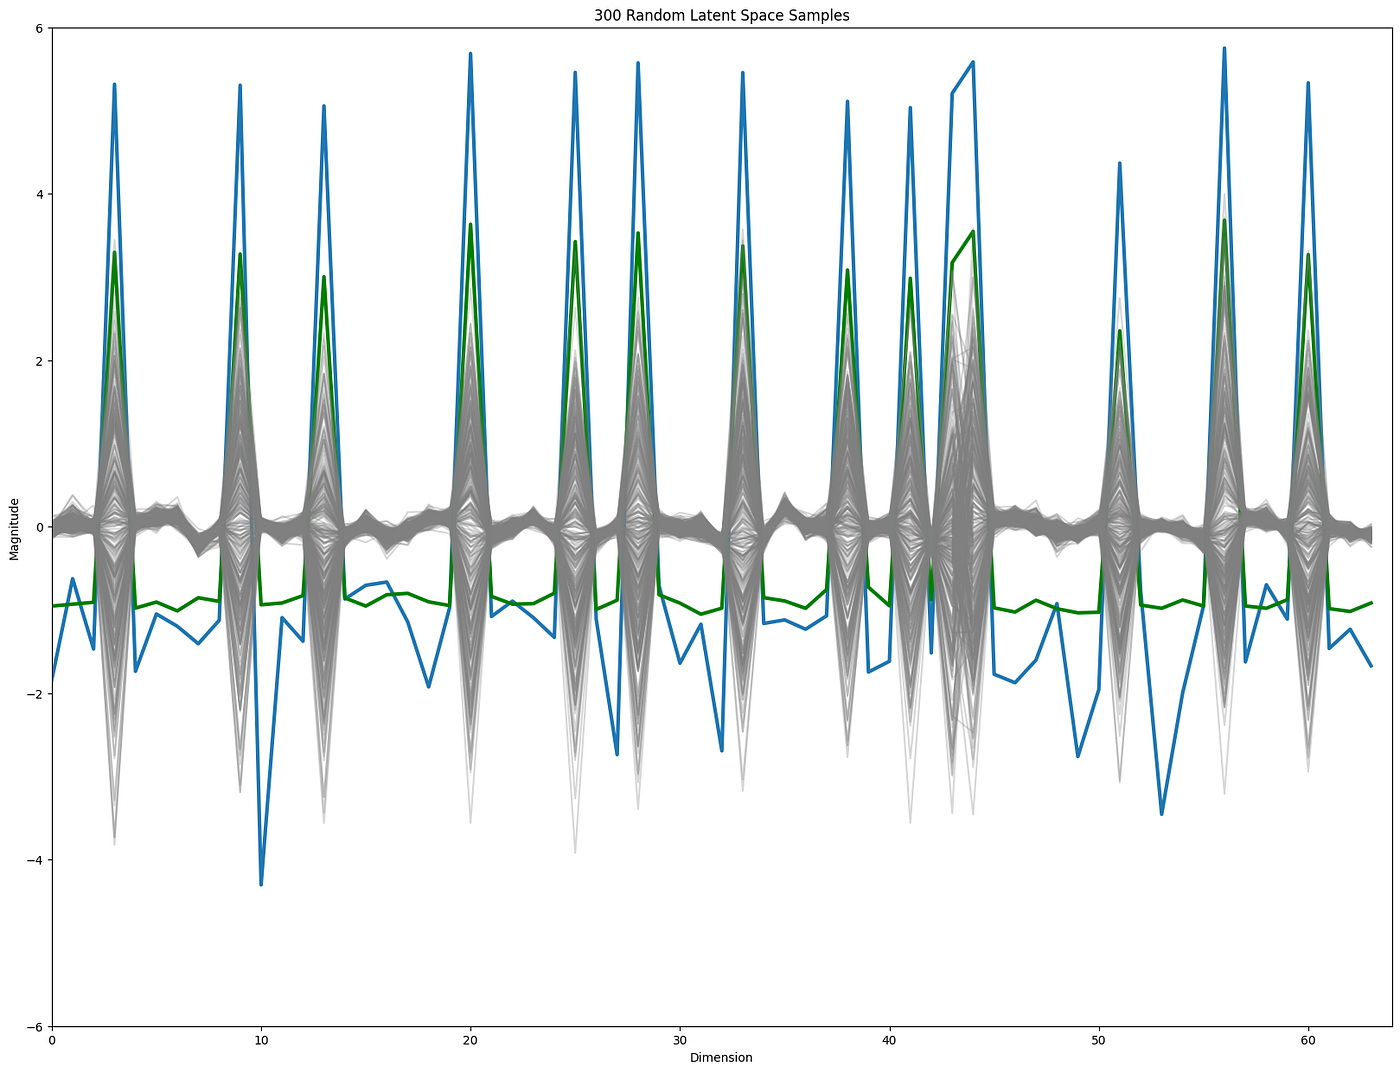
This is the case irrespectively of the distribution used (blue = position dependent, green = N(0,1)).
Positional sensitivity is tested in a simple for loop:
position_sensitivity_scores_norm = np.zeros(random_samples.shape[1])
for i in range(100):
    print("Processing example ", i)
    z = random_samples[i]
    for j in range(random_samples.shape[1]):
        z_matrix = np.tile(z, (100,1))
        #rand_position = np.random.choice(encodings[:,j], size=100)
        rand_position = np.random.normal(0, 1, size=100)
        z_matrix[:,j] = rand_position
        pos_recons = VAE_model.decoder(z_matrix)[0]
        pos_recons = tf.argmax(pos_recons, axis=-1)
        total_mismatches = tf.reduce_sum(tf.cast(oracle_reconstruction[i,:] != pos_recons, tf.int32))
        position_sensitivity_scores_norm[j] += total_mismatches
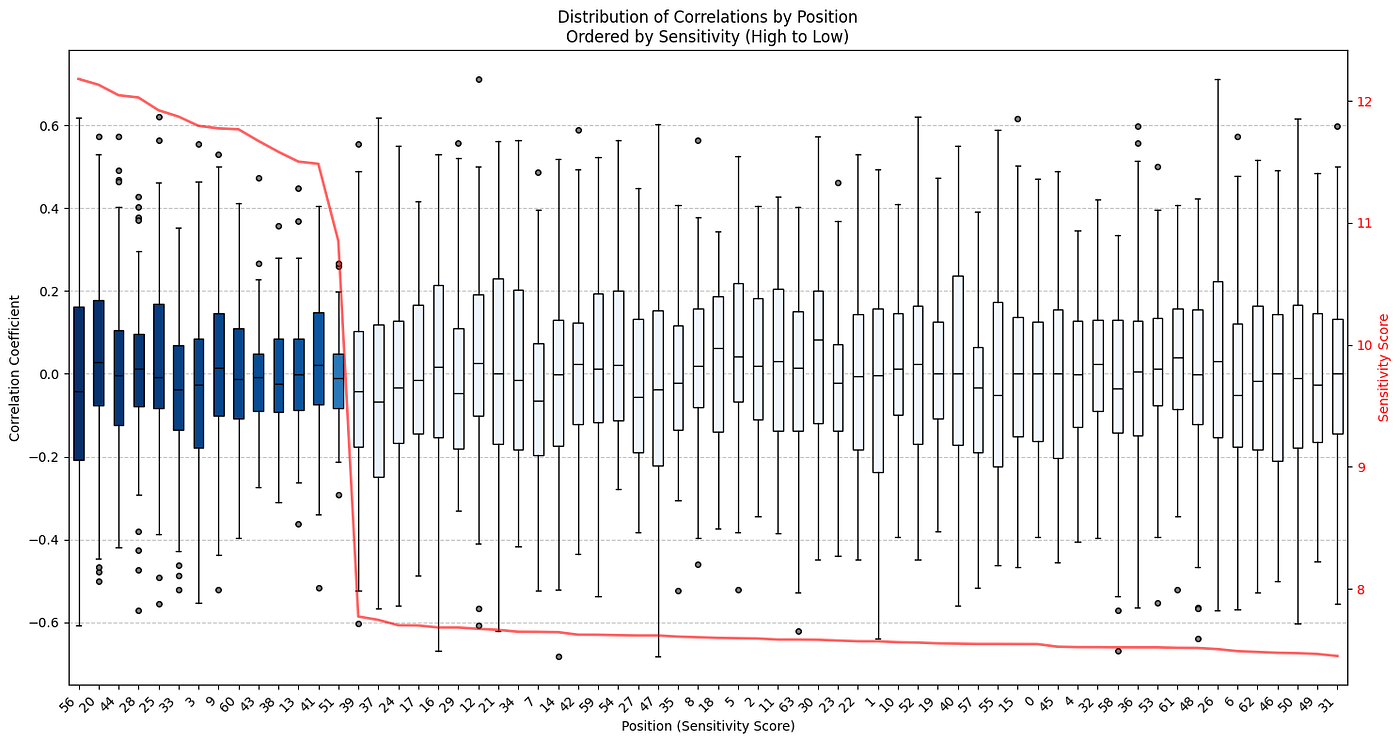
Now if there is also a strong correlation structure between specific positions in the latent dimensions, and/or an association of stronger correlation between sensitive positions this could make sampling difficult. Below the dimensions are ordered by sensitivity (high to low) and the y-axis shows a boxplot of the correlation coefficients for that particular position to all other positions.
def plot_sensitivity_correlation_boxplots(
    latent_vectors: np.ndarray,
    sensitivity_scores: np.ndarray,
    figsize=(15, 8)
) -> None:
    """
    Create boxplots of correlations for each position, ordered by sensitivity.

    Args:
        latent_vectors: Array of shape (n_samples, n_dims) containing latent vectors
        sensitivity_scores: Array of shape (n_dims,) containing sensitivity scores
    """
    n_dims = latent_vectors.shape[1]

    # Calculate correlation matrix
    corr_matrix = np.corrcoef(latent_vectors.T)
    np.fill_diagonal(corr_matrix, 0) # set self correlation to 0

    # Get order of positions by sensitivity
    ordered_positions = np.argsort(sensitivity_scores)[::-1]

    # Prepare data for boxplot
    boxplot_data = []
    position_labels = []

    for pos in ordered_positions:
        # Get all correlations for this position
        correlations = corr_matrix[pos]
        boxplot_data.append(correlations)
        position_labels.append(f"{pos}")

    # Create figure
    plt.figure(figsize=figsize)

    # Create boxplot
    bp = plt.boxplot(
        boxplot_data,
        labels=position_labels,
        patch_artist=True,
        medianprops=dict(color="black"),
        flierprops=dict(marker='o', markerfacecolor='gray', markersize=4)
    )

    # Color boxes based on sensitivity scores
    normalized_scores = (sensitivity_scores[ordered_positions] - sensitivity_scores.min()) / \
                       (sensitivity_scores.max() - sensitivity_scores.min())

    for i, box in enumerate(bp['boxes']):
        # Use a color gradient from light to dark blue based on sensitivity
        box.set_facecolor(plt.cm.Blues(normalized_scores[i]))

    # Customize plot
    plt.xticks(rotation=45, ha='right')
    plt.grid(True, axis='y', linestyle='--', alpha=0.7)
    plt.ylabel('Correlation Coefficient')
    plt.xlabel('Position (Sensitivity Score)')
    plt.title('Distribution of Correlations by Position\nOrdered by Sensitivity (High to Low)')

    # Add sensitivity score trend line on twin axis
    ax2 = plt.gca().twinx()
    ax2.plot(
        range(1, n_dims + 1),
        sensitivity_scores[ordered_positions],
        color='red',
        linewidth=2,
        alpha=0.6,
        label='Sensitivity Score'
    )
    ax2.set_ylabel('Sensitivity Score', color='red')
    ax2.tick_params(axis='y', labelcolor='red')

    # Adjust layout
    plt.tight_layout()
With the above in mind we could formulate an advanced sampling technique, common approaches are identifying semantic directions, learning Riemannian manifolds, etc. However, I much rather do a fast sampling technique and decoding, and filter the results based on a set of quality measures of the proposed formulation. This to me is much more pragmatic, and easier to adapt to different desires for formulation output.
Simple sampling
With a known positional distribution and co-variance structure we can simply generate samples from a multinomial distribution.
And this does a nice job of generating samples efficiently.
import numpy as np
from scipy import stats

def generate_latent_samples(n_samples, z):
    mean = np.mean(z, axis=0)
    cov = np.cov(z, rowvar=False)
    z_hat = stats.multivariate_normal.rvs(
        mean=mean,
        cov=cov,
        size=n_samples
    )
    return z_hat
Defining the quality measurements in the filtering step is now where we can start to have a systematic creative approach. I want the following:
- Ensure that ingredients are correctly ordered (high to low concentration)
- “Novel”, based on a uniqueness score of the mixture of ingredients
- Consumer relevant, based on the skin benefit scores
If I had additional data such as stability tests from prior formulation development this could be incorporated as well to filter for more optimal formulation solutions.
Systematic creativity
Generating a total of 10,000 random samples, calculating “uniqueness”, decoding the top 1000 most unique samples and finally running the remaining quality checks takes about 2 seconds on my M1 Macbook pro. A fairly modest laptop.
Naturally all of this needs to be wrapped in a UI/UX that allows for easy navigation between known formulations, their skin benefits, and editing of suggested formulations. My point here is, that these models are fast enough that we can start to think about a much more systematic approach to exploring the space of skincare formulations, potentially speeding up development time, and certainly taking an orthogonal approach to our creative process.
Here is an example of a suggested formulation:
 ['water',
  'dimethicone',
  'propanediol',
  'glycerin',
  'oenothera-biennis-oil',
  'squalane',
  'tocopheryl-acetate',
  '<unk>',
  'ceteth-20',
  'alcaligenes-polysaccharides',
  'disodium-edta',
  'petrolatum',
  'peg-7-glyceryl-cocoate',
  'phosphatidylcholine',
  'capryloyl-salicylic-acid',
  'polysorbate-60',
  'silica',
  'butyl-methoxydibenzoylmethane',
  'tocopherol',
  'sorbitol',
  'camellia-oleifera-seed-oil',
  'polysorbate-20',
  'ci-77491',
  'prunus-armeniaca-kernel-oil',
  'lecithin',
  'tromethamine',
  'niacinamide',
  'aloe-barbadensis-leaf-extract',
  'cholesterol'],
A humectant and emollient rich formulation, including some iron oxides and silica which creates an immediate light-reflecting property. While this does not translate directly into a ready to make formulation, it provides a starting point for further exploration, now with the added benefit of easily relating it to other products, consumer skincare benefits and many more parameters right out of the gates.
As the more expert skincare enthusiast will notice the “ordering” of ingredients is a bit off. This is work in progress on building a proper loss function (in the model training part) that respects the relative ordering of ingredients, while also generalizes well.